This recipe shows how to change needle color based on Value Example 1.
Major steps include the following:
- Create a blank report template (ChangeNeedleColorBasedOnValue.rml) using the datasource (FruitSales.ds).
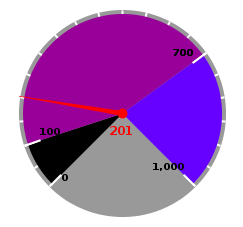
- Add a Meter Full Circle chart in the blank area under “Section Header”.
- Enter the following script in the “Script” tab page:if (cxt!=null)
{
var Data = cxt.getData();
var value2000 = Data.getMax(“2000”).getValueOverGroup();
if (value2000>100) plot.setNeedlePaint(java.awt.Color.red);
else plot.setNeedlePaint(java.awt.Color.blue);
}
To download the necessary files for this recipe, refer to the attached ZIP package.
ChangeNeedleColorBasedOnValueEg1.zip (3.5 KB)