This recipe demonstrates how to change the font and color properties of Meter Chart.
Major steps include the following:
- Create a blank report template (HowToChangeFontandColorProperties.rml) using the datasource (FruitSales.ds).
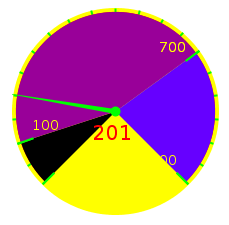
- Add a Meter Full Circle chart in the blank area under “Section Header”.
- Enter the following script in the “Script” tab page://Font for the Tick Value
plot.setTickLabelFont(new java.awt.Font(“SansSerif”,0,14));//Font for the Meter Chart
plot.setValueFont(new java.awt.Font(“SansSerif”,0,20));//Tick Label color
plot.setTickLabelPaint(java.awt.Color.yellow);//Inner Circumference color
plot.setDialOutlinePaint(java.awt.Color.red);//plot.setDrawBorder(false);//Label visible(Default is true, not neccessary to put if true)
plot.setTickLabelsVisible(true);//Tick color
plot.setTickPaint(java.awt.Color.green);//Background Color(Can also set in Meter Property)
plot.setDialBackgroundPaint(java.awt.Color.yellow);//Needle Color
plot.setNeedlePaint(java.awt.Color.GREEN);
To download the necessary files for this recipe, refer to the attached ZIP package.
ChangeFont&ColorProperties.zip (3.7 KB)