Overview
This entry outlines the steps to design a two-section RML report template that supports horizontal grouping and dynamic subreport integration, optimized for XLSX output.
Step 1: Create two data sources
i) First data source to calculate the total based on the period.

ii) Second data source is parameterized by ID and Code to populate their respective records.
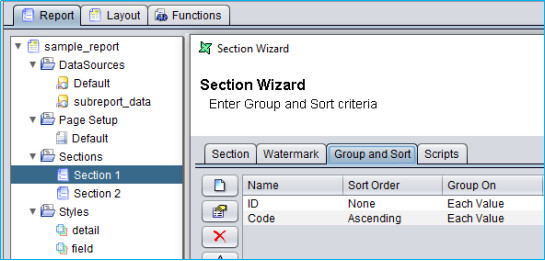
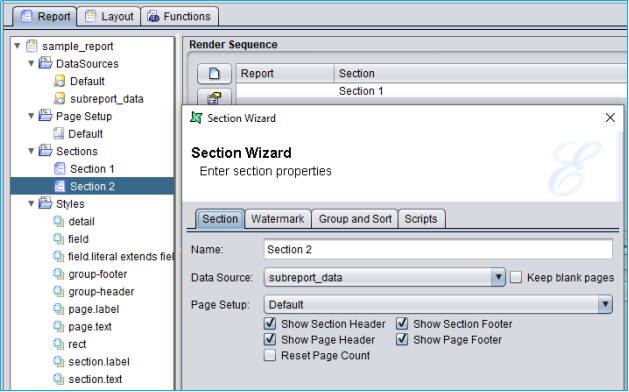
Step 2: Create a report template with two sections
i) First section
Map first data source and add groupings for ID and Code
Add field to sum up the Total values based on ID and Code groupings in the group header for ‘Code’ in a horizontal box cell, ensure the cell width aligns with the column headers.
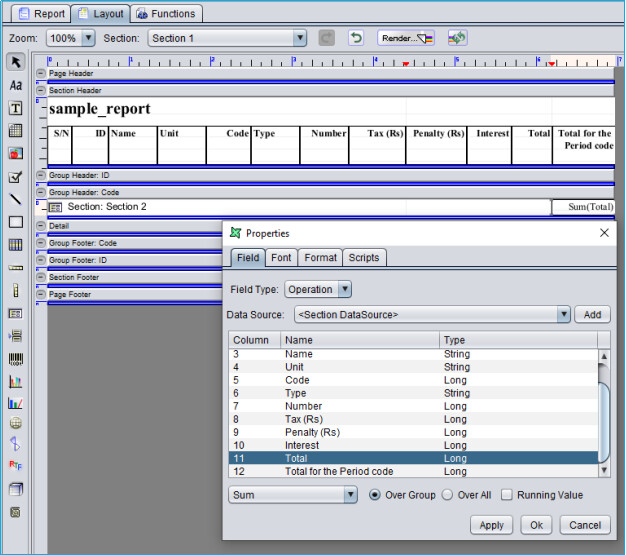
Add a sub report container for the second section in a horizontal box cell. Ensure the cell width aligns with the column headers.
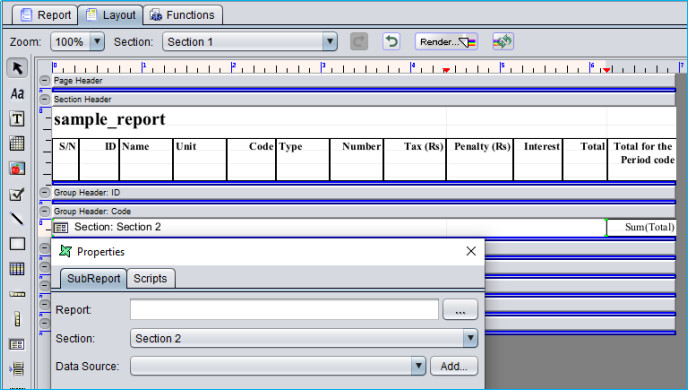
ii) Second section (Sub Report)
Map second data source to do a look up to the ID and Code fields from the first data source in first section.
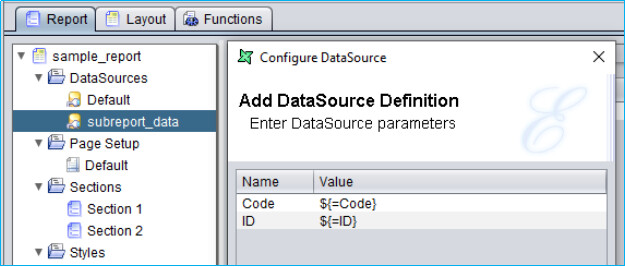
Map the second data source to the second section of the rml template.
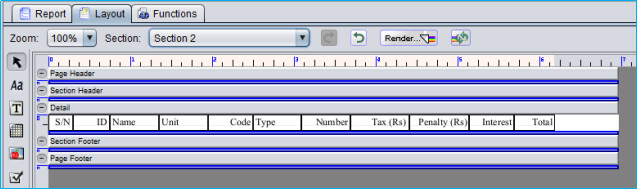
Layout the fields from the second data source in the second section, ensure the cell widths aligns with the column headers in the first section.
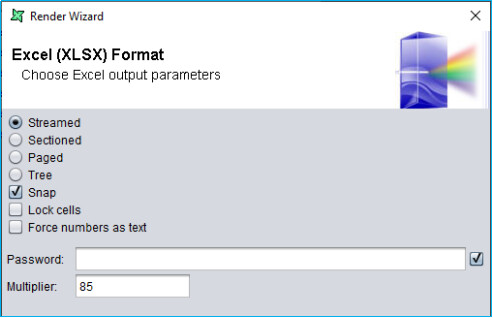
Step 3: Rendering the rml template
Select ‘Streamed’ and ‘Snap’ options when rendering to XLSX.
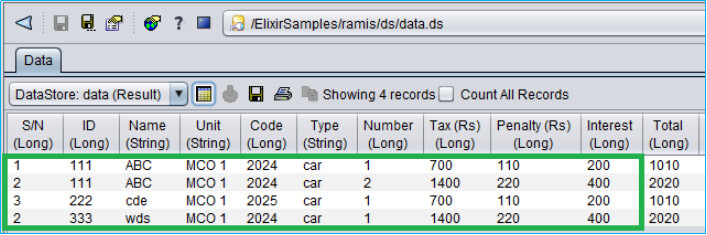
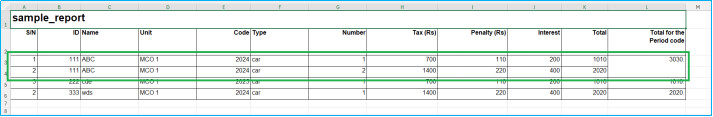
The template renders as follows.
Attachments
Horizontal Grouping with Parameterized Subreport.zip (10.5 KB)