This recipe demonstrates how to add marker in XY Line Chart and how to change font properties in XY Line Chart.
- How to add marker in XY Line Chart:
- Create a blank report template (HowToAddMarker.rml) using the datasource (FruitSales.ds).
- Add an XY Line Chart into the report template.
- Enter the following Java code into the “Script” tab:importPackage(Packages.org.jfree.chart.renderer.xy);
//new XYLineAndShapeRenderer(boolean line, boolean shape)
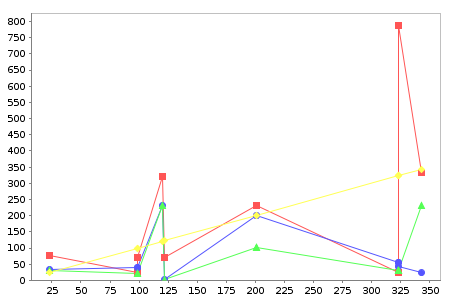
plot.setRenderer(new XYLineAndShapeRenderer(true, true)); - How to change font properties in XY Line Chart:
- Create a blank report template (HowToChangeFontProperties.rml) using the datasource (FruitSales.ds).
- Add an XY Line Chart into the report template.
- Enter the following Java code into the “Script” tab:importClass(Packages.com.elixirtech.ui.StandardColor);
var lineandshaperenderer = plot.getRenderer();
lineandshaperenderer.setItemLabelFont(new java.awt.Font(“SansSerif”,0,10));
lineandshaperenderer.setItemLabelPaint(StandardColor.lookup(“Red”));
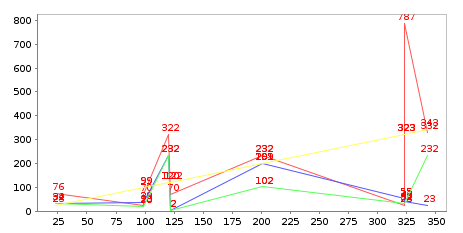
lineandshaperenderer.setItemLabelsVisible(true);
Screenshot of adding marker in XY Line Chart:
Screenshot of changing font properties in XY Line Chart:
To download the necessary files for this recipe, refer to the attached ZIP package.
XYChart.zip (5.5 KB)