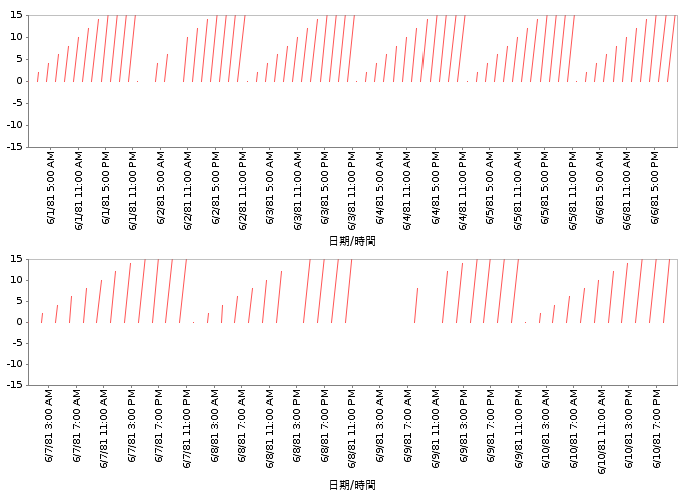
This recipe demonstrates how to display X axis in Wind Chart to be vertical and how to show Wind Rose Chart.
- How to display X axis in Wind Chart to be vertical:
- Create a blank report template (WindChart.rml) using the datasource (MDP03005_CP1.ds).
- Add a Wind Chart into the report template.
- Enter the following Java coding into the “Script” tab of the Chart Wizard:plot.domainAxis.setVerticalTickLabels(true);
plot.domainAxis.lowerMargin=0;
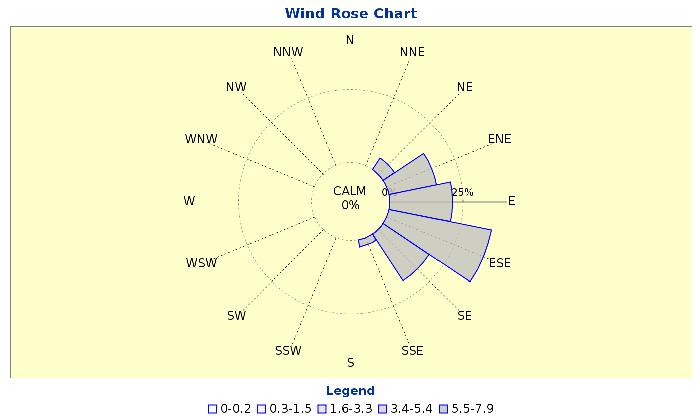
plot.domainAxis.upperMargin=0; - How to show Wind Rose Chart:
- Create a blank report template (WindRose.rml) using the datasource (MDP03005_CP1.ds).
- Add a Wind Rose Chart into the report template. The wind rose depicts the relative frequency of wind direction on a 16-point compass, with north, east, south, and west directions going clockwise. Each ring on the wind rose represents a frequency of a percentage of the total. The width of the color bars represents the frequency of wind from a given direction within a certain speed range.
Screenshot of Wind Chart with vertical X axis:
Screenshot of Wind Rose Chart:
To download the necessary files for this recipe, refer to the attached ZIP package.
WindChart.zip (7.4 KB)