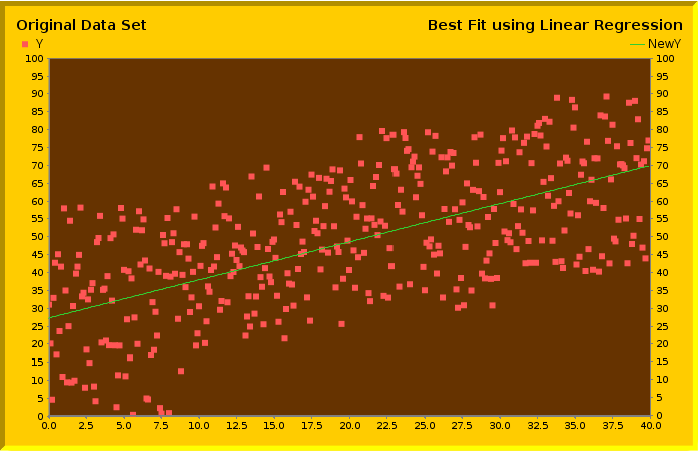
This recipe shows how to create an XY Scattered Chart and XY Line Chart for trend analysis.
Major steps include the following:
- Create a blank report template (Scattered Plot with Linear Regression for Trend Analysis.rml).
- Add a XY Line Chart into the report template, with “Key”=X and “Values”=NewY.
- Add the following script into the “Script” tab of the Chart Wizard:plot.rangeAxis.setRange(0, 100);plot.domainAxis.setRange(0, 40);plot.setRangeAxisLocation(Packages.org.jfree.chart.axis.AxisLocation.TOP_OR_RIGHT);importClass(Packages.com.elixirtech.chart2.custom.CustomDrawingSupplier);//Diagram of Named Colours available in//Elixir Report Designer User Manual, Figure 4.2. Name Colourspaints = [“LimeGreen”];cds = new CustomDrawingSupplier();cds.setPaintNames(paints);plot.drawingSupplier = cds;
To download the necessary files for this recipe, refer to the attached ZIP file.
Linear Regression.zip (8.1 KB)