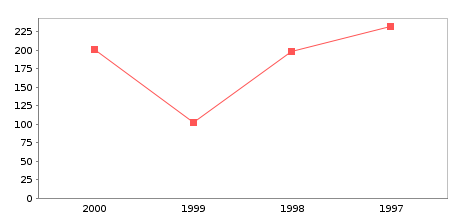
This recipe shows how to add markers for the line chart using script.
Major steps include the following:
- Create a blank report template (HowToAddLineMarker.rml).
- Add a line chart into the report template using the datasource (FruitSales.ds).
- Use the follwoing script to add markers for the Line Chart:importPackage(Packages.com.elixirtech.chart2.plot);var lineandshaperenderer = plot.getRenderer();lineandshaperenderer.setShapesVisible(true);

To download the necessary files for this recipe, refer to the attached ZIP package.
LineChart.zip (3.3 KB)