This recipe shows how to display the “Overall” and “OverGroup” minimum and maximum value of a Line Chart.
Major steps include the following:
- Create a blank report template (dynamicMinMax.rml) using the composite datasource (MDP03005_CP1.ds).
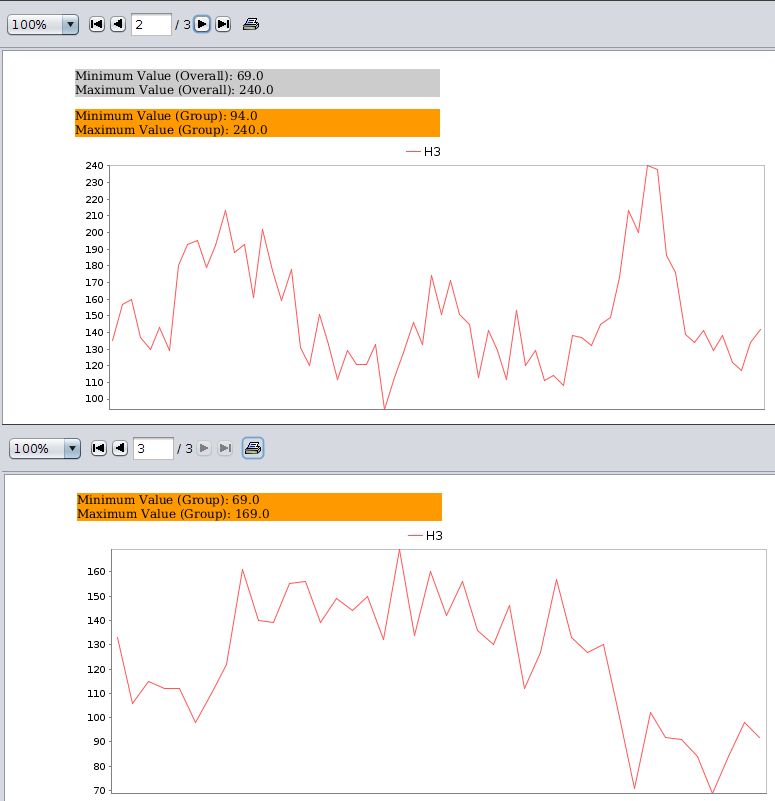
- Add the following script under “Section Header”:"Minimum Value (Overall): " + Data.getMin(“H3”).getValueOverAll()"Maximum Value (Overall): " + Data.getMax(“H3”).getValueOverAll()
- Add the following script under “Group Header”:"Minimum Value (Group): " + Data.getMin(“H3”).getValueOverGroup()"Maximum Value (Group): " + Data.getMax(“H3”).getValueOverGroup()
- Add a Line Chart under the script in “Group Header” using the composite datasource (MDP03005_CP1.ds), with Key=”Time” and Values=”H3”. Copy the following script into the “Script” tab of the Chart Wizard:if (cxt!=null){var Data = cxt.getData();plot.domainAxis.lowerMargin=0;plot.domainAxis.upperMargin=0;plot.rangeAxis.setRange(Data.getMin(“H3”).getValueOverGroup(),Data.getMax(“H3”).getValueOverGroup());}
To download the necessary files for this recipe, refer to the attached ZIP file.
DynamicMinMax.zip (5.7 KB)