This recipe demonstrates how to dynamically select/call two charts, and eventually overlap the both charts.
Major steps include the following:
- Create a blank report template (DynamicChartSelection.rml).
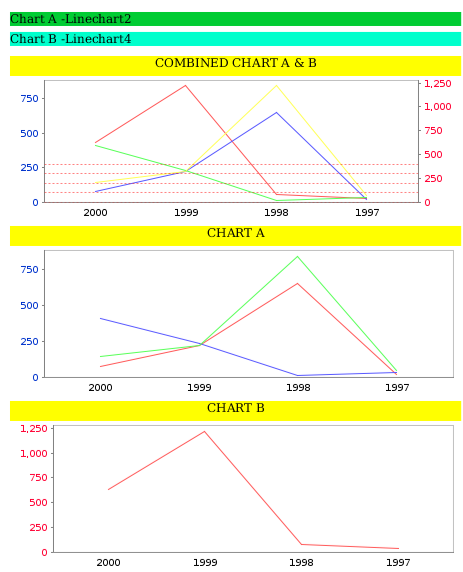
- Add script into the “Page Header” Properties, which will display the selected datasources (Linechart1, Linechart2, Linechart3 or Linechart4) to render Chart A and Chart B.
- Add a Line Chart (Combined Chart A & B) into the blank area under “Section Header”: Use correct script to overlap Chart A and Chart B after you select their datasources.
- Add a second Line Chart (Chart A) below the first one: Chart A will be rendered upon your selection of the datasource.
- Add a third Line Chart (Chart B) below the second one: Chart B will be rendered upon your selection of the datasource.
To download the necessary files for this recipe, refer to the attached ZIP file.
DynamicCharts.zip (5.6 KB)