This recipe demonstrates how to change the look of Pie 3D chart, and how to make the selected area of Pie Chart pop/explode.
Major steps include the following:
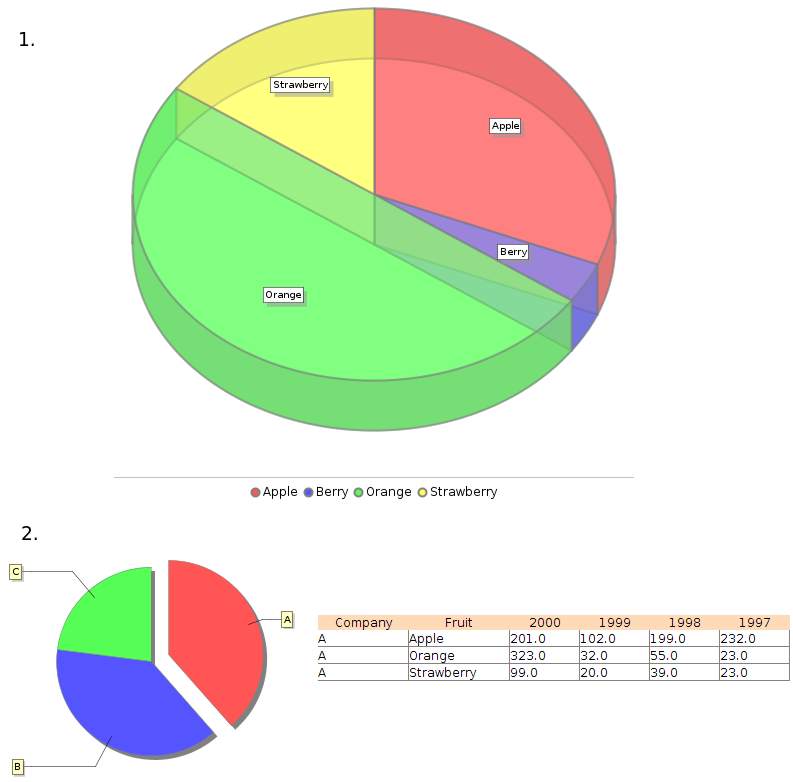
- Create a dashboard (MouseOverChart.pml) and add a Pie 3D chart (Mouse Over Chart) into the dashboard, using the FruitSales datasource: Use the correct script (as in MouseOverChart.txt) to change the look of Pie 3D chart with opacity and tooltip.
- Create a dashboard (PieChartExplodeSelection.pml), add a Pie chart (FruitSales) and a table (FruitSales1) into the dashboard, using the FruitSales datasource: Use the correct script (as in PieChartExplodeSelection.txt) to make the selected area of the Pie Chart pop/explode.
To download the necessary files for this recipe, refer to the attached ZIP file.
DashboardChartings.zip (4.8 KB)