This recipe demonstrates how to create two overlapping charts in one report template using JavaScript.
Major steps include the following:
- Create a composite datasource (MDP03036_CP.ds): add the elements carefully to ensure a correct logical relation.
- Create a Blank Report Template (ChartsOverlap.rml): the two charts will be placed in the same report template.
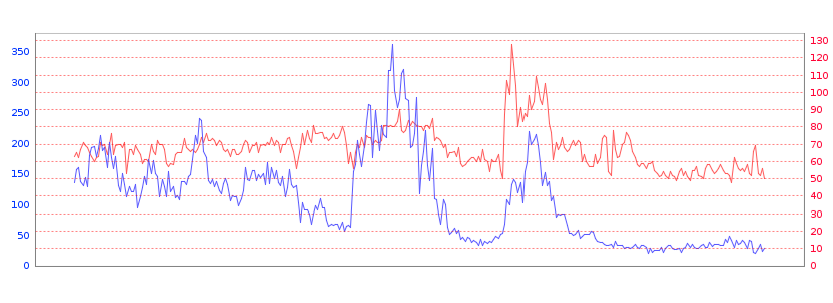
- Add a Line Chart into the upper part of the report template (ChartsOverLap.rml): the script can make the two charts overlap in the rendered output.
- Add another Line Chart into the lower part of the report template (ChartsOverLap.rml): the script can make the two charts overlap in the rendered output.
To download the necessary files for this recipe, refer to the attached ZIP file.
CombineCharts.zip (8.8 KB)