This alt_colors.zip (2.1 KB) sample shows how to shade every other detail row by attaching a short On Render Begin script to the Detail band. The band recolors itself from the current record index as each row renders, so the striping needs no extra columns, no conditional styles, and no changes to the datasource.
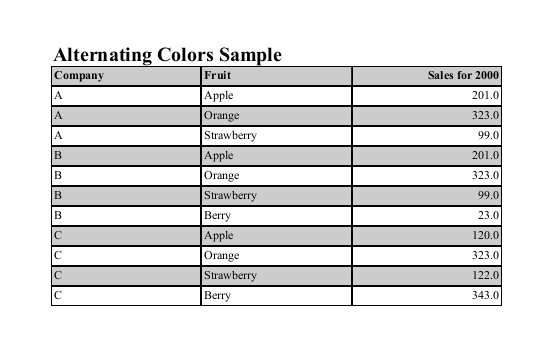
The report binds to the standard FruitSales sample (Company / Fruit / Sales for 2000) and prints one detail row per record, with even rows white and odd rows light grey.
1. Prerequisites
The template’s datasource points to /ElixirSamples/DataSource/FruitSales.ds, the tabulated FruitSales sample. If it isn’t already in your repository, add it, or repoint/remap to any tabular source; the technique only needs a sequential record index, not this specific data.
2. Add the report to the repository
Upload alt_colors.rml to a repository folder and open it in the Report Designer. The layout has one section: a Section Header (the “Alternating Colors Sample” title plus a grey column-header row) and a Detail band with three fields: Company, Fruit, and the Sales column (2000).
3. Open the Detail band’s On Render Begin script
Select the Detail band, open its script/event editor, and choose the On Render Begin event. Set the language to JavaScript. This event fires once per detail row, immediately before that row is laid out and this is when the row’s background is decided.
4. Recolor the band from the record index
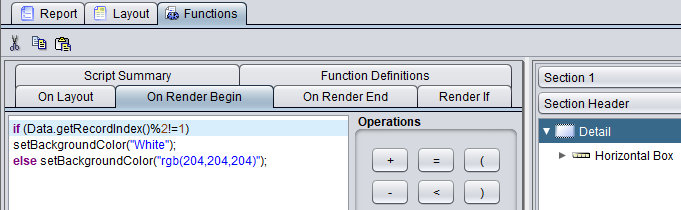
Input the following:
if (Data.getRecordIndex()%2!=1)
  setBackgroundColor("White");
else
  setBackgroundColor("rgb(204,204,204)");
Data.getRecordIndex() returns the zero-based index of the current record. % 2 != 1 is true for the even indices (0, 2, 4, …), which are painted white; odd indices fall to the else and are painted light grey. setBackgroundColor() accepts either a named color ("White") or an rgb(r,g,b) string, e.g. rgb(204,204,204) is #CCCCCC. To use different colors, or to flip which rows are shaded, change the two color strings or invert the test.
Configuration Note: the index is continuous over the whole report, so the shading alternates
straight down the page and does not restart per Company. If you need the stripes to reset inside each group, drive the color from a per-group counter rather than from getRecordIndex().
5. Keep the detail fields’ own background clear
setBackgroundColor() colors the band, and that color is only visible where the fields sitting on the band don’t paint over it. In this sample the detail fields use the simple.text style, which sets borders and fonts but no background color, so the band shows through. If a field (or its style) defines its own BackgroundColor, that cell keeps that color regardless of the script. Leave the detail fields’ background properties unset for the stripes to show.
6. Render the report
Run the report. With the FruitSales sample you get the grey header row followed by detail rows that alternate white / grey down the full list; A·Apple white, A·Orange grey, A·Strawberry white,
B·Apple grey, and so on to the last record, exactly as in the attached screenshot.
Note: the header row’s grey is set directly on the header fields
(background-color="rgb(204,204,204)"), independently of the Detail-band script; the two simply share the same grey.