Scripting with Chart
To display custom colors for charts(Applicable for: Area, Bar, Column, Pie):
=Code Snippet=
importClass(Packages.com.elixirtech.chart2.custom.CustomDrawingSupplier);
//Diagram of Named Colours available in
//Elixir Report Designer User Manual, Figure 4.2. Name Colours
paints = ["DarkSeaGreen","Gold","LightCoral","CornflowerBlue","GreenYellow"];
cds = new CustomDrawingSupplier();
cds.setPaintNames(paints);
plot.drawingSupplier = cds;
To change the legend’s font:
=Code Snippet=
getLegend().setItemFont(new java.awt.Font("Arial",0,20));
To place the y-axis on the right:
=Code Snippet=
plot.setRangeAxisLocation(Packages.org.jfree.chart.axis.AxisLocation.TOP_OR_RIGHT);
To put a background image on a chart you can use the following script(Applicable for: Area, Bar, Column, Line, Meter, Pie, Polar, Stocks, Waterfall, XY):
For Version 8.1.1 and earlier
See [* org.jfree.ui.Align] options
=Code Snippet=
url = new java.net.URL("repository:/ElixirSamples/Resources/images/LogoElixir.gif");
im = Packages.javax.imageio.ImageIO.read(url);
plot.backgroundImage = im;
plot.setBackgroundImageAlignment(Packages.org.jfree.ui.Align.TOP_LEFT);
// Instead of plot area only, the image can be shown in the entire chart area with:
backgroundImage = im;
setBackgroundImageAlignment(Packages.org.jfree.ui.Align.TOP_LEFT);
For Version 8.2.x and later
=Code Snippet=
var is = Packages.com.elixirtech.util.
URLLoader.getInputStream("repository:/ElixirSamples/Resources/images/LogoElixir.gif");
var im = Packages.javax.imageio.ImageIO.read(is);
plot.backgroundImage = im;
plot.setBackgroundImageAlignment(Packages.org.jfree.ui.Align.LEFT);
To show colors of a chart based on the values of the field(Applicable for: Area, Bar, Column, Line, Pie):
=Code Snippet=
//Importing the Chart class for usage
importClass(Packages.com.elixirtech.chart2.custom.CustomDrawingSupplier);
var ds = plot.getDataset();
var rows = ds.getRowCount();
var paints = Array();
for (i=0;i<rows;i++)
{
//ds.getValue() is the values as defined in 'Value' Tab
var value = ds.getValue(i,0);
if (value>500) paints[i] = "Red";
else paints[i] = "Gold";
}
cds = new CustomDrawingSupplier();
cds.setPaintNames(paints);
plot.drawingSupplier = cds;
To add markers for the Line Chart:
=Code Snippet=
importPackage(Packages.com.elixirtech.chart2.plot);
var lineandshaperenderer =  plot.getRenderer();
lineandshaperenderer.setShapesVisible(true);
To display patterns instead of color for charts(Applicable for: Area, Bar, Column, Pie):
=(A known issue for version 6.1, please do not use with version 6.1)=
=Code Snippet=
importClass(Packages.com.elixirtech.chart2.custom.CustomDrawingSupplier);
paints = ["Diag","Horiz","Wave","RDiag"];
cds = new CustomDrawingSupplier();
cds.setPaintNames(paints);
plot.drawingSupplier = cds;
To remove the labels from the Pie Chart, you can use the following script:
=Code Snippet=
*plot.setLabelGenerator(null);*
To remove the individual legend from the Multiple Pie Chart, you can use the following script:
=Code Snippet=
var chart = plot.getPieChart();
chart.removeLegend();
To include value in Label for Pie Chart, you can include the field name in ‘Key’ tab:
=Code Snippet=
Fruit + " - " + _2000
//where Fruit and 2000 is the Field Name
To include the percentage value on the label for Multiple Pie Chart, you can include the following in ‘Script’ tab:
=Code Snippet=
importClass(Packages.org.jfree.chart.labels.StandardPieSectionLabelGenerator);
var chart = plot.getPieChart();
var p = chart.plot;
p.setLabelGenerator(new StandardPieSectionLabelGenerator("{0} = {1} ({2})"));
To include the percentage value on the label for Pie Chart, you can include the following in ‘Script’ tab:
=Code Snippet=
importClass(Packages.org.jfree.chart.labels.StandardPieSectionLabelGenerator);
var gen = new StandardPieSectionLabelGenerator("{0} = {1} ({2})");
plot.setLabelGenerator(gen);
To include the percentage value on the label for Pie Chart with the decimal format, you can include the following in ‘Script’ tab:
=Code Snippet=
importClass(java.text.DecimalFormat);
importClass(Packages.org.jfree.chart.labels.StandardPieSectionLabelGenerator);
var gen = new StandardPieSectionLabelGenerator("{0} = {1} ({2})", new DecimalFormat("0.00"), new DecimalFormat("0.00%"));
plot.setLabelGenerator(gen);
To custom format a Date in the Legend’s label, you can include the following in ‘Script’ tab:
=Code Snippet=
importClass(Packages.org.jfree.chart.labels.CategorySeriesLabelGenerator);
var df = new java.text.SimpleDateFormat("dd/MM/yyyy")

function generateLabel(dataset,series)
{
var data = dataset.getRowKey(series)
return df.format(data)
}

*plot.renderer.setLegendItemLabelGenerator(generateLabel);*
**To change the font properties for Pie Chart:**

=Code Snippet=
*plot.labelFont = new java.awt.Font("SansSerif",0,18);*
To change the font properties for Meter Chart:
=Code Snippet=
//Font for the Tick Value
plot.setTickLabelFont(new java.awt.Font("SansSerif",0,14));

//Font for the Meter Chart
plot.setValueFont(new java.awt.Font("SansSerif",0,20));
To change the font properties for XY Chart:
=Code Snippet=
*importClass(Packages.com.elixirtech.ui.StandardColor);*

var lineandshaperenderer =  plot.getRenderer();
lineandshaperenderer.setItemLabelFont(new java.awt.Font("SansSerif",0,10));
lineandshaperenderer.setItemLabelPaint(StandardColor.lookup("Red"));
lineandshaperenderer.setItemLabelsVisible(true);
XY Chart, to display month abbreviation instead of an integer on the x-axis:
=(Work with Elixir Repertoire 6.2 and above)=
=Code Snippet=
*importPackage(Packages.com.elixirtech.chart2.custom);*

var oldtu = plot.domainAxis.getTickUnit();
var newtu = TickUnitFactory.getShortMonths(true);
var tu = new CustomNumberTickUnit(oldtu,newtu);
plot.domainAxis.setTickUnit(tu);
To add markers for the XY Chart:
=Code Snippet=
importPackage(Packages.org.jfree.chart.renderer.xy);
//new XYLineAndShapeRenderer(boolean line, boolean shape)
plot.setRenderer(new XYLineAndShapeRenderer(true, true));
To change the text orientation for a chart(Applicable for: Area, Bar, Column, Line, Waterfall):
=Code Snippet=
importClass(Packages.org.jfree.chart.axis.CategoryLabelPositions);
domainAxis = plot.getDomainAxis();
/**
* Math.PI / 1 = 180 degree
* Math.PI / 2 = 90 degree
* Math.PI / 4 = 45 degree
* Math.PI * 2 = 360 degree (Default horizontal layout)
*/
mydegree=4;
domainAxis.setCategoryLabelPositions(
CategoryLabelPositions.createUpRotationLabelPositions(Math.PI /mydegree)
);
To create exploded 2d pie chart on a dashboard:
=Code Snippet=
if (cxt)
{
  // reset explode
  var total = plot.getDataset().getKeys().size();
  for (var i=0;i<total;i++)
  {
    plot.setExplodePercent(i,0);
  }
  // explode selected
  var sel = cxt.getSelection().nextSetBit(0);
  if (sel>=0)
  {
    var table = cxt.getDataSource();
    var rec = table.getRecord(sel);
    plot.setExplodePercent(rec.getData(0),0.2);
//rec.getData(0) refers to the record
  }
}
In addition, you will need to create an action event that refreshes the chart view on the dashboard on every click.
To dynamic display minimum and maximum values(Applicable for: Meter):
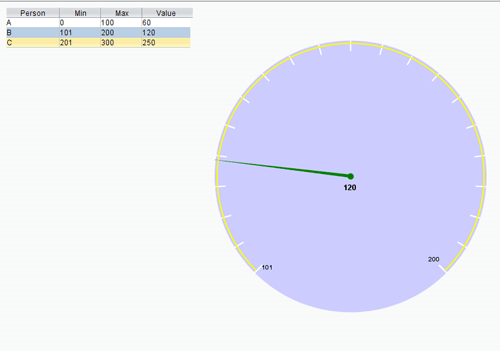
=(Work with Elixir Repertoire 7.2 and above)=
=Code Snippet=
importClass(Packages.org.jfree.chart.plot.MeterInterval);
importClass(Packages.org.jfree.data.Range);
println("A");
if (cxt!=null)
{
   println("B");
   var ds = cxt.getDataSource();
   println(ds);
   println(ds.getRecordCount());
   if (ds.getRecordCount()>0)
   {
       println("Got record");
       var rec = ds.getRecord(0);
       var min = rec.getData(ds.getColumnIndex("Min"));
       var max = rec.getData(ds.getColumnIndex("Max"));
       var name = rec.getData(ds.getColumnIndex("Person"));
       var range = new Range(min,max);
       plot.setRange(range);
       plot.addInterval(new MeterInterval(name,range));
   }
}
To make the gap of bar chart closer between each axis
importClass(Packages.org.jfree.chart.axis.CategoryAxis);
plot.getDomainAxis().setCategoryMargin(0.5);
To remove the shadow of bar/column chart
importPackage(Packages.com.elixirtech.chart2.plot);
var chart =  plot.getRenderer();
chart.setShadowVisible(false);
To set auto range of axis for line chart
plot.getRangeAxis(0).setAutoRangeIncludesZero(false);
plot.getRangeAxis(0).setAutoRange(true);
To increase upper Margin for chart
plot.getRangeAxis(0).setUpperMargin(0.2);
To remove item labels
plot.getRePreformatted textnderer(0).setItemLabelsVisible(false);
To make the gap of bar chart closer on each axis
plot.getRenderer().setItemMargin(0.05);
Set the background gradient
var grey = new java.awt.Color(0xA0A0A0);
var white = new java.awt.Color(0xFFFFFF);
var gradient = new java.awt.GradientPaint(0, 0, grey, 0, 200, white);
plot.setBackgroundPaint(gradient);
Set bar chart with gradient
// replace the built-in bar gradient with a flat one, so we can paint our own gradient
importClass(Packages.org.jfree.chart.renderer.category.StandardBarPainter);
plot.getRenderer().setBarPainter(new StandardBarPainter());

var bluer = new java.awt.Color(0x0000DD);
var blue = new java.awt.Color(0x000080);
var gradient2 = new java.awt.GradientPaint(0, 0, blue, 0, 0, bluer);
plot.getRenderer().setSeriesPaint(0,gradient2);
Remove Pie Chart Shadow
plot.setShadowPaint(null);
For Multiple Pie Chart
plot.getPieChart().getPlot().setShadowPaint(null);
Change the shape of the point in the line graph
Use setShape(object) function in jfreechart. To draw a small rectangle for all the markers in the graph, in Script tab of the line graph, put:
importPackage(Packages.com.elixirtech.chart2.plot);
var lineandshaperenderer =  plot.getRenderer();
lineandshaperenderer.setShape(new java.awt.Rectangle(-1, -1, 2, 2));
To modify the markers of each line, use setSeriesShape(index, object)
importPackage(Packages.com.elixirtech.chart2.plot);
var lineandshaperenderer =  plot.getRenderer();
lineandshaperenderer.setSeriesShape(0, new java.awt.Rectangle(-1, -1, 2, 2));
lineandshaperenderer.setSeriesShape(1, new java.awt.Rectangle(-1, -1, 2, 2));
lineandshaperenderer.setSeriesShape(2, new java.awt.Rectangle(-1, -1, 2, 2));
lineandshaperenderer.setSeriesShape(3, new java.awt.Rectangle(-1, -1, 2, 2));
To change the bars and lines color in the chart:
In the Colour tab in Chart Wizard, untick the “Automatic generation of legend colors” option so that the customize colors could take effect:
Most scripting explains above can be found in the ChartScripting.jar.
For more information on the available method for Charts, please refer to the API available.
Reference: http://www.jfree.org/jfreechart/